
Cardiac VTI - The New IVC for Fluid Responsiveness?
Using the IVC for Fluid Responsiveness is Falling Out of Favor
Recently, there has been a trend away from using ultrasound interrogation of the IVC diameter to determine fluid responsiveness. A 2020 systematic review and meta-analysis in the Journal of Intensive Care Medicine by Ordo et al found a pooled sensitivity and spec of 0.71 and 0.75, respectively. As clinicians shifted away from measuring IVC diameter, there was some thought that maybe respiratory variation of the IVC would be a better predictor than IVC diameter. Assessing IVC respiratory variation became a popular approach for predicting fluid responsiveness. Unfortunately, studies demonstrated variable predictability and limited benefit [1-3]. Does a better option exist?
Our goal is essentially to identify patients who will increase their cardiac output (CO) when given fluids. It’s an added bonus if this can be done rapidly and through a non-invasive approach. Many studies use cardiac output as the gold standard to which they test against. Why not jump straight to a derivative of CO?
Emerging evidence suggests cardiac velocity time integral (VTI), a measurement obtained by ultrasound, can be used to predict fluid responsiveness [4-5]. Basically, cardiac VTI is a component of the cardiac output equation as CO= LVOT area x VTI x HR. When VTI increases, you can infer that your stroke volume (LVOT area x VTI = SV) and cardiac output do as well. If I’ve lost you in the equations, take a moment to review this great YouTube video!
So how can you start using cardiac VTI in your ED?
First, work on getting the proper ECHO views and messing around with the spectral doppler on your US machine. This will take some practice! Newer ultrasound machines have a cardiac calculations package as well as artificial intelligence (auto-VTI) that can measure VTI for you, making your job easier!
Here are the steps to do it manually:
1. Start by obtaining an apical-5 chamber view and placing a pulsed wave doppler (PWD) gate right at the ventricle side of the LVOT (left ventricular outflow tract) approximately 1 cm from the valve. Ensure the flow through the LVOT is parallel to your US beam (the apex of heart should be at the top of your screen, see image below).
2. Press your PWD button again and you should obtain a nice negative waveform tracing (flow is away from your probe, and therefore it displays a negative tracing) as seen below.
3. Under your advanced cardiac measurements, you should have a VTI option to trace your waveform like in the image below. This should give you a VTI. Normal is 18-22cm. I would trace multiple waveforms and average them for accuracy.
4. If VTI is low (<18cm) try a passive leg raise on your patient for 1-2 min. This can provide the equivalent of a 500cc fluid bolus without giving them anything you can’t take back! Immediately after, calculate another VTI. If you see a change of >10-15%, your patient is likely a fluid responder.

Image on the left showing the negative waveform tracing used to calculate the VTI. Image on right shows the 5 chamber view.
If you are feeling more adventurous, try obtaining the patient's cardiac output. This takes more views and measurements, but it is doable. Additional steps include obtaining the parasternal long axis (PSLA) and measuring the left ventricular outflow tract (LVOT) at the ventricular side of the aortic valve annulus in systole (see image below). Normal is 2cm in the absence of valve pathology. Ensure that you carefully obtain the LVOT measurement! Erroneous measurements will throw off your calculation as this diameter is squared in our cardiac output equation. Many US machines will calculate the area for you. If you have a handheld or incapable US machine, see the equation below to calculate the area manually. After this, follow steps 1-4 above. Once you input VTI, you should get cardiac output in your results on the US machine.
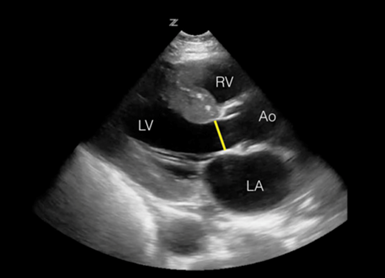
The LVOT is measured in a parasternal long axis.

Limitations
There are some limitations of this calculation. First of all, it takes practice! Obtaining ECHO views in some patients can be challenging. Also, VTI is not accurate when there is aortic pathology, such as regurg. Arrhythmias can also affect the accuracy of VTI. If the patient is in an arrhythmia, such as atrial fibrillation, it is recommended that you average multiple VTIs for better accuracy.
Summary
In conclusion, cardiac VTI seems like a promising tool for predicting fluid responsiveness in our hypotensive ED patients. We are great sonologists in the emergency department and with continued practice, this is definitely in our wheelhouse!
Learn More
Check out this excellent blog post by Downeast Emergency Medicine to learn more about VTI.

References
1. Long E, Oakley E, Duke T, Babl FE; Paediatric Research in Emergency Departments International Collaborative (PREDICT). Does Respiratory Variation in Inferior Vena Cava Diameter Predict Fluid Responsiveness: A Systematic Review and Meta-Analysis. Shock. 2017 May;47(5):550-559. doi: 10.1097/SHK.0000000000000801. PMID: 28410544.
2. Musikatavorn K, Plitawanon P, Lumlertgul S, et al. Randomized Controlled Trial of Ultrasound-guided Fluid Resuscitation of Sepsis-Induced Hypoperfusion and Septic Shock. West J Emerg Med. 2021;22(2):369-378. doi:10.5811/westjem.2020.11.48571
3. Caplan M, Durand A, Bortolotti P, et al. Measurement site of inferior vena cava diameter affects the accuracy with which fluid responsiveness can be predicted in spontaneously breathing patients: a post hoc analysis of two prospective cohorts. Ann Intensive Care. 2020;10(1):168. Published 2020 Dec 11. doi:10.1186/s13613-020-00786-1
4. Blanco P. Rationale for using the velocity-time integral and the minute distance for assessing the stroke volume and cardiac output in point-of-care settings. Ultrasound J. 2020;12(1):21. Published 2020 Apr 21. doi:10.1186/s13089-020-00170-x
5. Wang J, Zhou D, Gao Y, Wu Z, Wang X, Lv C. Effect of VTILVOT variation rate on the assessment of fluid responsiveness in septic shock patients. Medicine (Baltimore). 2020;99(47):e22702. doi:10.1097/MD.0000000000022702
about the author
Dr. Hansen was born in New Jersey but grew up in Clearwater, FL. She completed medical school at Campbell University College of Osteopathic Medicine and did her residency training at Hackensack University Medical Center in New Jersey. In July of 2020, she began her Ultrasound Fellowship at USF. Her interests include ultrasound, powerlifting, cooking, relaxing, reading nonfiction, enjoying the outdoors, staring at the stars, and lingering on the coast.
This post was edited by Drs. Charlotte Derr & Enola Okonkwo.